
The supply chain that refused to come home
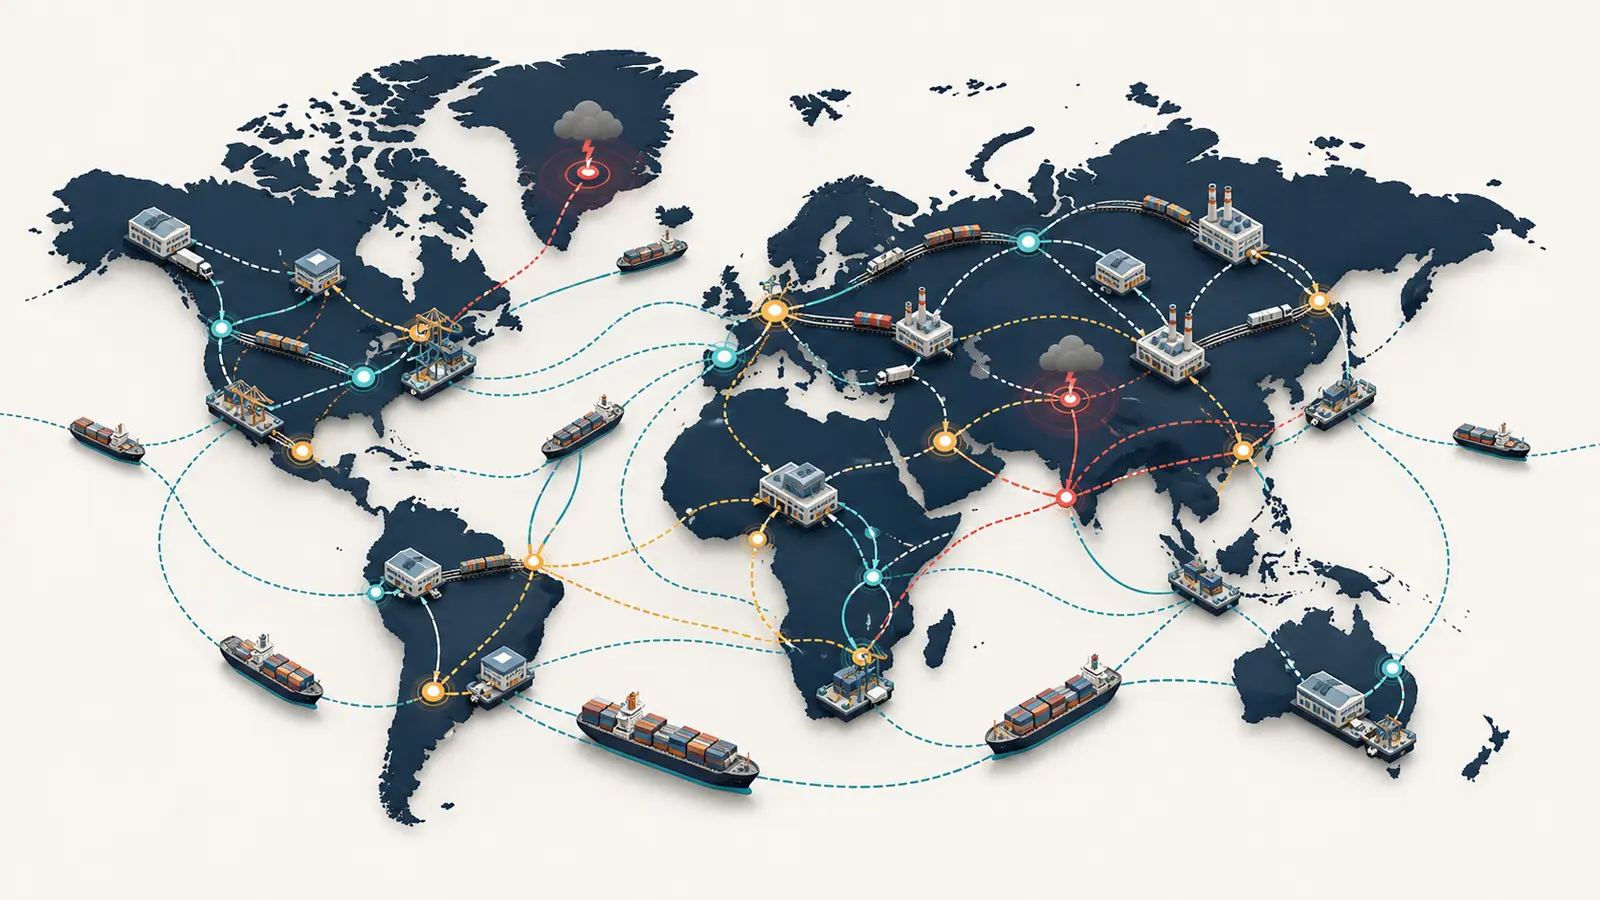
For several years, corporate supply-chain strategy was described as a retreat. Factories would come home, distant suppliers would be replaced, inventories would rise and global networks would become shorter. The reality visible at the start of 2024 was more complicated. Companies wanted resilience, but they still needed international scale, specialised capacity, competitive costs and access to new customers. Instead of reversing globalisation, many were redesigning it.
A 41-page Economist Impact report on trade in transition, released on January 16, 2024 and supported by DP World, captured that tension through a survey of 3,500 senior executives across every major region. The research team led by project director John Ferguson found no single winning configuration. Diversification remained the most common response, yet a rapidly growing group of firms preferred fewer, more deeply connected suppliers. Nearshoring attracted attention but did not become the default.
The lesson for management is not that one camp was right. It is that the supply chain had become a portfolio of different operating models. Critical components might need two geographically separated sources. Commodity inputs might benefit from broad competition. A tightly specified industrial part might perform better with one strategic partner and a jointly financed improvement plan. Finished goods could require regional distribution even when production remained global. Resilience came from matching each flow to its economics and consequences.
What the 2024 evidence actually showed
The headline numbers describe a market moving in two directions at once. In the survey, 45% of executives still favoured supplier diversification as their primary reconfiguration strategy, only slightly below 47% in the preceding survey. At the same time, 26% chose to work with fewer suppliers, a rise of 16 percentage points. That is not a statistical contradiction. It reflects different decisions inside different product families, sectors and stages of production.
Consumer-goods businesses must absorb volatile demand and frequent product changes. Multiple qualified suppliers can prevent a shortage at one plant from emptying shelves everywhere. Industrial companies often depend on precise tolerances, certification, specialised tooling and long learning curves. Adding vendors may multiply quality risk, while concentrating orders with a capable partner can support better traceability and investment. The best structure is therefore conditional, not ideological.
Regionalisation was less dominant than the political conversation suggested. Roughly one fifth of respondents chose nearshoring or regionalisation as the main strategy. Companies were not ignoring distance; they were refusing to treat distance as the only risk. A nearby supplier can still depend on the same upstream material, electricity grid, software provider or transport corridor as a remote alternative. Two names in a purchasing database do not create redundancy when both fail for the same reason.
Four signals behind the portfolio model
- Diversification stayed popular because alternative sources preserve flexibility during local disruption.
- Supplier consolidation grew because deeper relationships can improve quality, visibility and joint problem-solving.
- Nearshoring remained selective because cost, capabilities and customer growth still pull networks across borders.
- Digital visibility mattered because managers cannot balance these choices without dependable multi-tier data.
Diversification is not the same as adding vendors
A procurement team can increase the supplier count and make the system less resilient. If new vendors are all located in one floodplain, buy the same subcomponent or rely on the same port, the apparent variety is cosmetic. Useful diversification separates failure modes. It asks whether a second source changes geography, technology, ownership, logistics, energy exposure and regulatory jurisdiction.
This distinction changes how a firm measures concentration. Spend share is only the beginning. Managers also need to map production capacity, tooling ownership, lead times, substitute materials and the speed at which demand can be shifted. A supplier representing 10% of annual spend may be more critical than one representing 40% if its inexpensive component can halt an entire assembly line.
True diversification also costs money. Each supplier needs qualification, forecasting, contracts, audits, information security and ongoing demand. Splitting a small volume too widely can leave every partner without enough business to justify investment. The portfolio must therefore buy real optionality rather than an impressive number of inactive alternatives.
Why fewer suppliers can sometimes create more resilience
Consolidation is often portrayed as a return to dangerous dependency, but the result depends on the relationship. A transactional sole source with opaque capacity is fragile. A strategic supplier that shares production data, maintains agreed reserves, participates in joint planning and has a tested recovery site may be more dependable than five poorly understood vendors.
Deep collaboration can reveal risk earlier. It gives both sides a reason to coordinate engineering changes, allocate scarce materials and remove bottlenecks. Longer commitments can support automation, cleaner equipment or additional capacity that a supplier would not finance against short purchase orders. The buyer gains influence not by constantly threatening to leave, but by making the relationship valuable enough to improve.
The danger is complacency. Concentrated partners need measurable service levels, open-book assumptions where appropriate, financial monitoring and contingency rights. Intellectual property, tooling and technical documentation must remain recoverable. The objective is not loyalty for its own sake; it is a relationship whose economics fund resilience without making exit impossible.
From a binary choice to a segmentation discipline
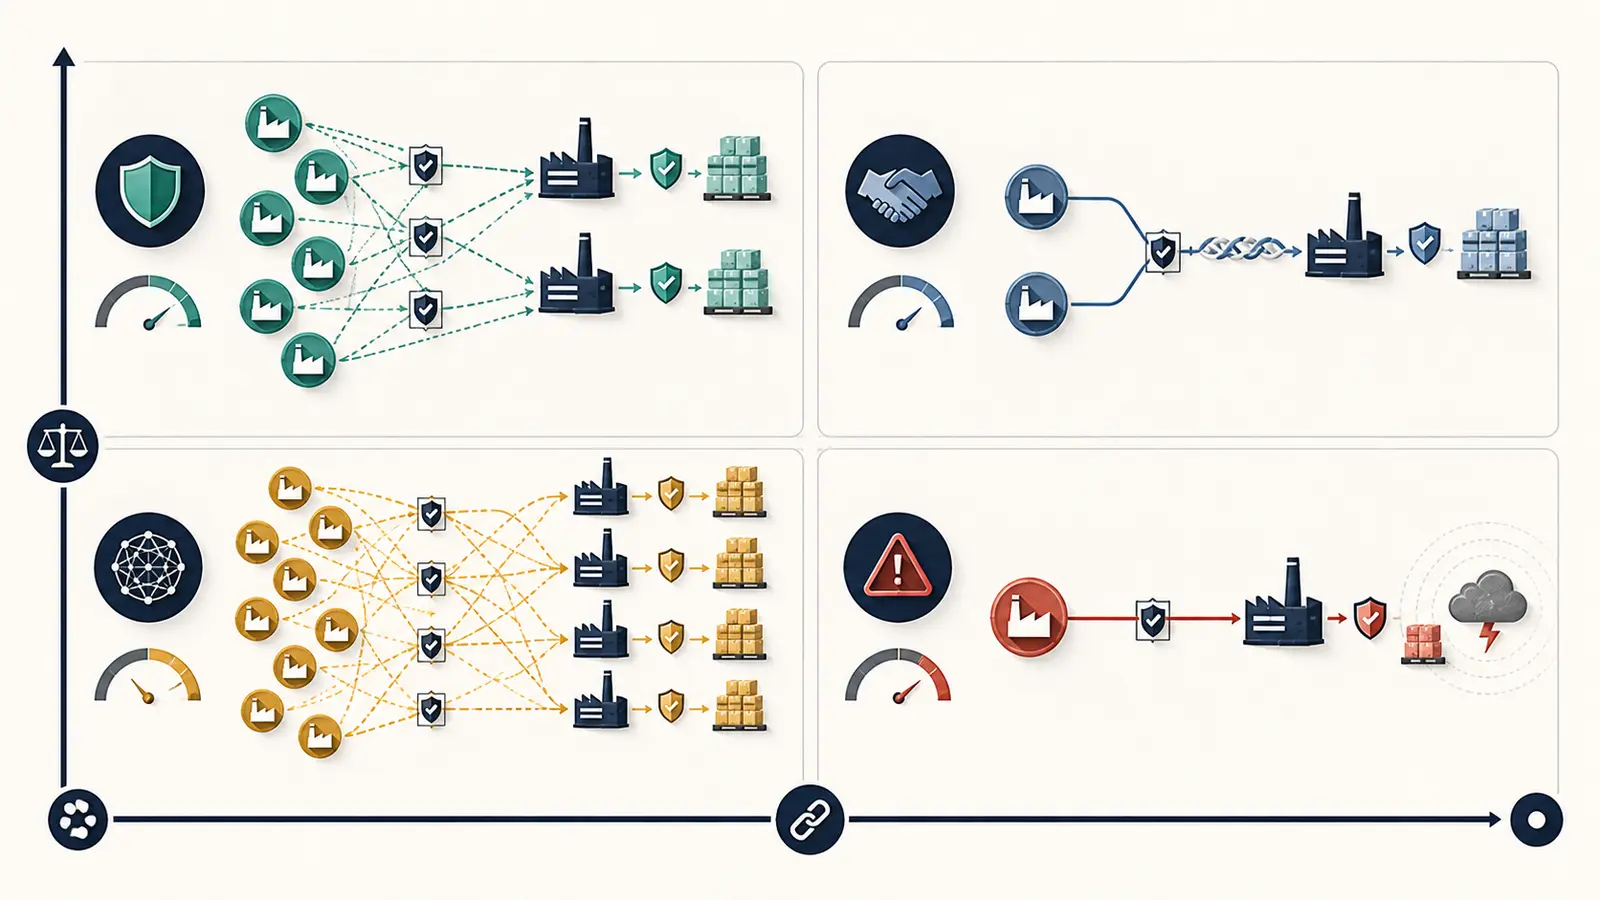
The practical alternative to a company-wide slogan is segmentation. Every material, service and route should be placed in a group defined by business impact and substitution difficulty. The categories do not need to be elaborate. They need to lead to different actions.
- Strategic bottlenecks: rare, technically demanding inputs require deep partnerships, executive attention and a funded alternative path.
- Scalable commodities: standard inputs can support several suppliers, competitive allocation and rapid volume shifts.
- Regional response items: bulky, perishable or time-sensitive goods may justify capacity close to customers.
- Innovation partnerships: components tied to product differentiation may need long contracts, shared engineering and protected knowledge.
- Routine services: easily substituted purchases should avoid unnecessary customisation and concentration.
This method turns resilience from an emergency project into routine capital allocation. It also resolves the apparent tension in the Economist Impact findings. The same manufacturer can consolidate a specialised component, diversify raw materials, regionalise final assembly and keep a global logistics network. Each decision answers a different operational question.
The geography problem is about correlation
Geopolitical risk made location a board-level variable in 2024. The report found 36% of executives prioritising friendshoring and 32% creating parallel supply chains. Tensions between the United States and China illustrated why firms wanted alternatives without abandoning established ecosystems.
Geographic redundancy must again be tested for common dependencies. Plants on different continents can share one cloud platform, one specialist machine maker or one source of a critical mineral. A route that appears independent may converge at a canal, transshipment port or insurer. Scenario planning should follow the product from raw material through each tier, not stop at the address on a supplier invoice.
Companies also need to distinguish exposure from probability. A low-probability closure of a unique source can deserve more investment than frequent delays in a replaceable lane. Expected financial loss, recovery time and customer consequence provide a more useful language than a colourful risk map alone.
Why complete reshoring rarely solves the commercial equation
Moving production home can reduce some transport and political risks, but it may add labour constraints, higher input prices and a smaller supplier ecosystem. It can also separate production from fast-growing customers. The report found 26% of surveyed companies pursuing expansion into new export markets, slightly more than the 24% concentrating on growth in existing markets. A network designed only for security can quietly undermine revenue.
Reshoring is most credible when proximity changes the economics: automation reduces labour sensitivity, intellectual property needs exceptional protection, products are expensive to transport, or customer lead times justify local capacity. In other cases, dual production or delayed final configuration may capture much of the resilience benefit without duplicating the entire chain.
The correct comparison includes transition cost. New factories take time to qualify. Local suppliers may initially have lower yields. Old contracts can carry exit penalties, while duplicated capacity lowers utilisation. A board should compare steady-state benefits with the cash, working capital and execution risk required to reach them.
Inventory is insurance with a financing cost
The pandemic made buffer stock a visible symbol of resilience. By 2023, surveyed firms held an average of 9.0 weeks of inventory, down from 10.1 weeks in 2022 but still close to the 8.9 weeks reported in 2021. The small reduction mattered because expensive capital and warehousing turned indiscriminate stockpiles into a drag on returns.
Inventory should be placed where it buys the most recovery time. A few weeks of a small bottleneck component may protect far more sales than months of bulky finished goods. Postponement can help: keeping generic modules and completing regional configuration after demand becomes clearer reduces both shortage risk and obsolescence.
Digital tools support the decision but do not eliminate uncertainty. The report said 35% of executives were using artificial intelligence to optimise inventory levels, while 34% viewed improved digital inventory management as the leading way to cut supply-chain costs. Algorithms can identify patterns and simulate policies, but they inherit incomplete master data and assumptions about disruptions that have not yet happened.
Artificial intelligence needs an operating model
Adoption was broad: 98% of respondents said artificial intelligence touched at least one supply-chain activity. That figure is impressive but says little about value. A demand forecast cannot improve availability if commercial teams override it without explanation. A risk alert is useless when no manager owns the response. A supplier model becomes dangerous when identifiers, locations and parent relationships are wrong.
High-value applications connect prediction with authority. A system can estimate demand ranges, flag a capacity constraint, propose allocation and show the margin or customer impact of each choice. People then approve the trade-off under defined rules. The feedback from actual results improves the next decision. Technology becomes an operating loop rather than a collection of dashboards.
Companies should measure forecast bias, response time, avoided expedites, inventory turns and service outcomes. They should also record false alarms and missed events. Without those controls, artificial intelligence can create the appearance of precision while managers continue to work around it in spreadsheets and messages.
Fragmentation has a price beyond procurement
The report modelled a hypothetical split in high-technology trade between geopolitical blocs. Its scenario produced a short-term global output decline of about 0.9%, with larger effects in some economies. The numbers are not forecasts; they are structured estimates of what can happen when barriers remove efficient relationships faster than substitutes emerge.
The World Trade Organization’s 2023 analysis of re-globalisation reached a related conclusion: wider international options can improve resilience by reducing dependence on a single market, whereas blanket fragmentation may cut firms off from alternatives. For business, the important distinction is between diversification and division. The first expands options; the second can shrink them.
Executives should therefore avoid treating geopolitical alignment as a complete supplier assessment. Friendly jurisdictions can still have infrastructure bottlenecks, skills shortages or correlated policy changes. Neutral markets can offer capacity but introduce longer routes and different compliance obligations. Strategy requires a priced set of trade-offs rather than a map divided into safe and unsafe colours.
Faster delivery is a financial strategy
Nearly one quarter of executives identified faster time to market as the most important outcome of recent supply-chain decisions. Speed is more than a customer promise. Short lead times reduce forecast error, working capital and the amount of inventory required to protect service. They also allow a firm to test new markets with smaller commitments.
Yet speed must be measured end to end. A fast factory paired with slow approvals, unpredictable customs clearance or batch-based planning can leave total lead time unchanged. Value-stream mapping should include information delays as well as physical movement. Often the cheapest improvement is not another warehouse but an earlier decision or a cleaner data handoff.
Resilience and speed can reinforce each other. A network with visible capacity and pre-approved alternatives can respond to disruption without waiting for a crisis committee. Standard product interfaces make volume portable. Contracts that define emergency allocation reduce negotiation when supply is scarce.
Governance: who owns the portfolio?
Supply-chain design crosses procurement, operations, finance, sales, technology and compliance. If each function optimises its own metric, the company gets conflicting policies: purchasing rewards the lowest unit price, finance cuts inventory, sales promises every order and operations protects utilisation. A resilient portfolio needs a shared decision system.
A quarterly portfolio review should answer five questions
- Which products create the largest profit and customer exposure if supply stops?
- Where do apparently independent suppliers share a hidden dependency?
- Which alternatives are qualified, contracted and capable rather than merely listed?
- How much resilience premium is the company paying, and what loss does it protect?
- Which assumptions changed since the previous review and who owns the response?
The review should connect operational evidence to capital decisions. Supplier tooling, reserve inventory, a second route and a new planning platform compete for the same funds. Comparing them through recovery time, cash impact and strategic value prevents resilience spending from becoming an unprioritised wish list.
A practical scorecard for 2024-style uncertainty
A useful scorecard combines service, economics and adaptability. Service measures include on-time delivery, completeness and recovery performance. Economic measures include landed cost, working capital, expedite expense and capacity utilisation. Adaptability measures include time to qualify an alternative, share of revenue with mapped multi-tier dependencies and the percentage of critical volume that can move within a defined period.
No single score should dominate. The lowest landed cost can hide catastrophic concentration. Maximum redundancy can destroy margins. Excellent average service can conceal one untested bottleneck. The portfolio view makes these tensions explicit and allows leaders to accept risk consciously.
Scenario exercises keep the scorecard honest. Teams can remove a port, supplier, data platform or market and calculate the operational response. The result is not a prediction. It is a test of whether contracts, data, inventory and authority fit together when normal routines fail.
The management playbook
Businesses do not need to rebuild every network at once. They need a repeatable sequence that directs attention to the highest-consequence flows.
- Map products to revenue, margin and customer obligations.
- Trace critical inputs beyond direct suppliers to common upstream nodes.
- Segment each flow by substitution difficulty, volatility and strategic importance.
- Choose diversification, consolidation, regionalisation or a hybrid for that segment.
- Fund the enabling work: qualification, data sharing, tooling, inventory or route capacity.
- Assign an owner and a measurable recovery objective.
- Test the design, learn from the result and update the portfolio quarterly.
This sequence also disciplines technology investment. Data platforms and artificial intelligence should support a defined decision, not precede it. The relevant question is not whether a company has a digital twin, but whether it can identify a constraint sooner and move volume with less loss.
The strategic conclusion
The most important 2024 supply-chain shift was not a march from global to local. It was the end of the universal recipe. Executives were diversifying some flows, consolidating others, adding parallel capacity, refining inventory and using technology to see the resulting complexity. The apparent contradictions were evidence of more granular management.
A resilient network is neither the longest nor the shortest, neither the cheapest nor the most redundant. It is the one whose dependencies are understood, whose alternatives are real and whose commercial purpose remains intact under stress. That requires patient supplier development, hard choices about capital and a willingness to measure resilience as an operating capability.
The companies that master this portfolio approach do more than survive disruption. They enter markets faster, allocate scarce supply with greater confidence and turn supplier knowledge into product improvement. In a world where shocks differ by sector, route and technology, strategic variety becomes an advantage—provided that the business can govern it as one coherent system.






ADI News
Leave a comment